7 SQS Lambda ESM Scaling Behaviours
#Overview
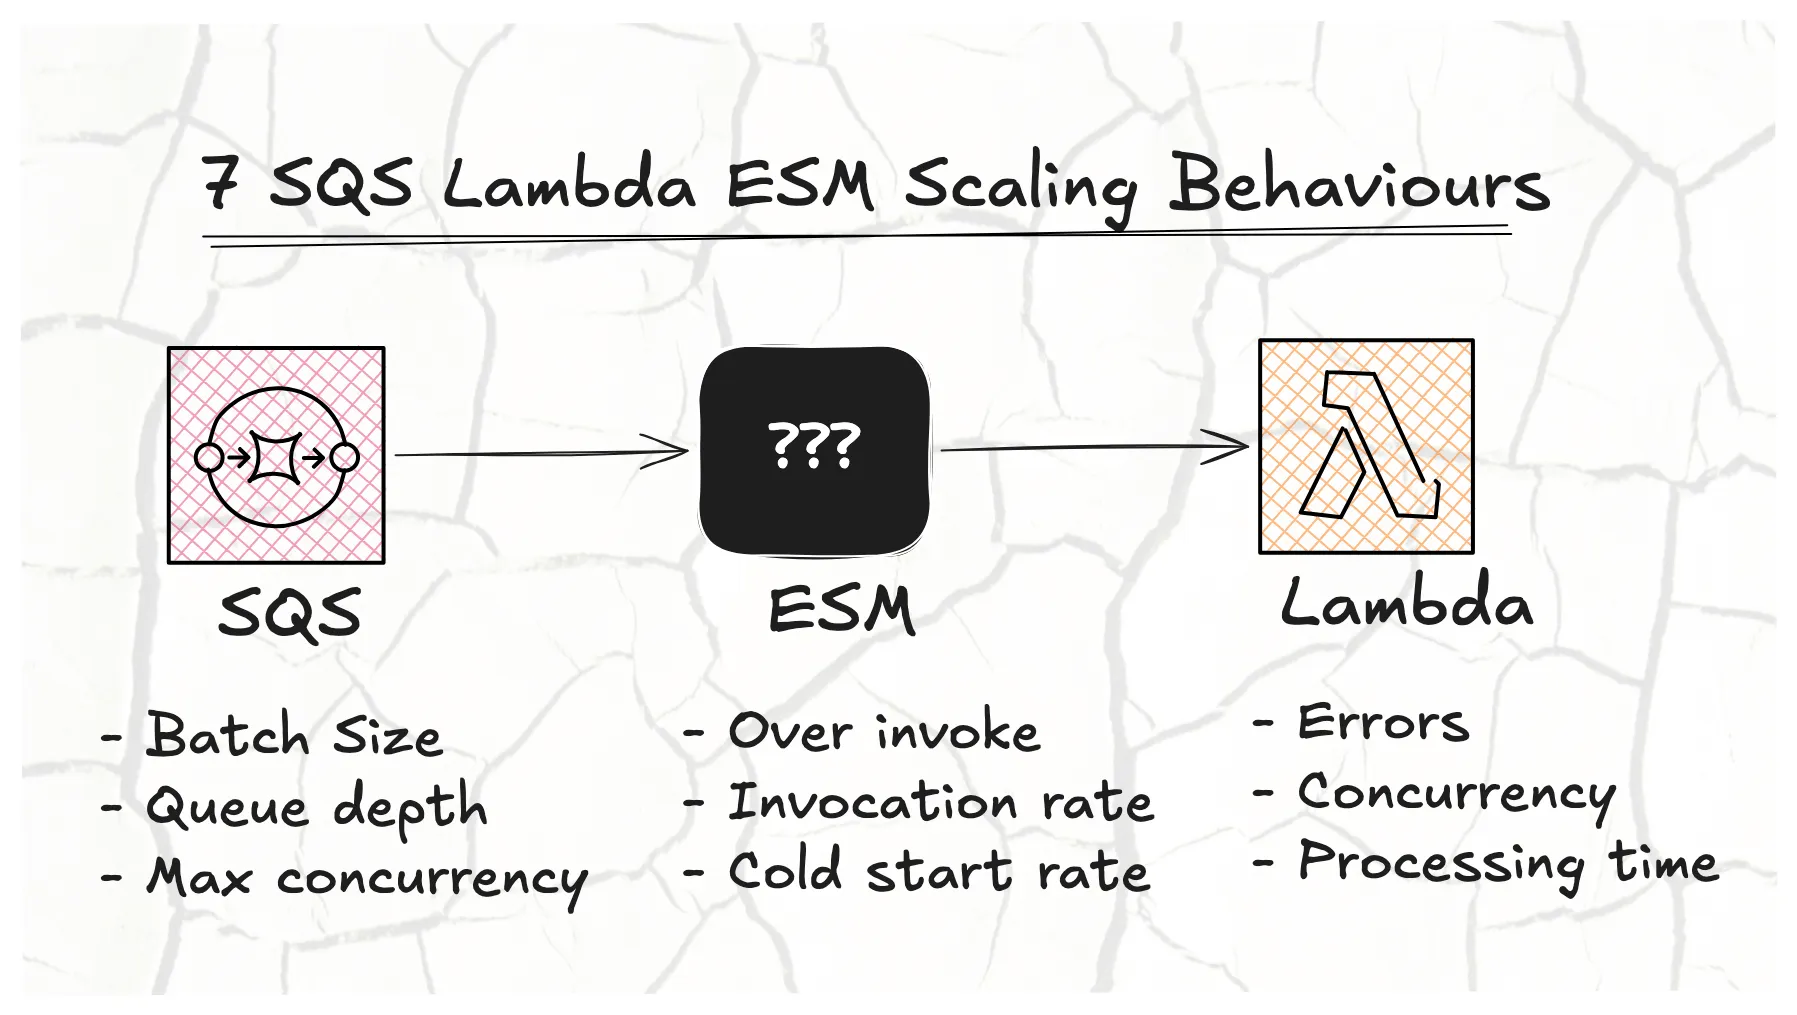
Event Source Mapping (ESM) is a Lambda feature that automatically polls event sources like SQS and invokes your function with those messages.
I have been noticing some interesting ESM SQS Lambda scaling behavior for a while, so I figured I would finally write it down so I can point to it instead of just saying “from experience.”
I have run 100s of experiments, queued and processed millions of messages with Lambda over the past month. This post is a summary of all my observations, unexpected results and learnings about the ESM SQS Lambda scaling behaviour.
#What does (and doesn’t) AWS say about SQS Lambda scaling?
The AWS docs has a brief section on the Standard scaling behaviour for SQS Lambda (much more focus is now on Provisioned mode), which states:
For standard queues, Lambda uses long polling to poll a queue until it becomes active. When messages are available, Lambda starts processing five batches at a time with five concurrent invocations of your function. If messages are still available, Lambda increases the number of processes that are reading batches by up to 300 more concurrent invokes per minute. The maximum number of invokes that an event source mapping can process simultaneously is 1,250.
What we know:
- Start with 5 concurrent invocations (1 batch per invocation)
- Increase the number of concurrent invocations by up to 300 per minute if messages are still available
- The maximum number of concurrent invokes is 1,250
They cover a few milestone numbers but don’t explain the important details. I want to know:
- Why is the invocation rate not uniform? There is a spike at the start, but only sometimes.
- Why have I seen that increasing batch size produces a lower initial invocation rate?
- Why does my Lambda concurrency spike above the set maximum ESM concurrency?
- Will the number of available messages determine the invocation rate?
#Observations:
- Lambda invocation and cold start rate are not dependent on queue depth
- Lambda invocation and cold start rate are dependent on batch size
- Lambda ramps up invocations aggressively, then drops sharply into steady state
- Large Lambda deployments cause concurrency spikes if ESM Concurrency is unbound
- The ESM poller over-invokes above ESM max concurrency
- The ESM poller creates more concurrent functions than it needs to invoke
- Errors have a significant impact on throughput
#1. Lambda invocation and cold start rate are not dependent on queue depth
Here we can see that the rate (lines all overlapping) is the same regardless of queue depth. This suggests the ESM poller is not using queue depth as a signal for scaling up the number of instances.
In this experiment we paused the ESM Lambda poller and enqueued different numbers of messages (1,000; 10,000; 100,000; 1,000,000) before resuming the poller and measuring the invocation and cold start rate over time. Batch size is kept at 1 and processing time at 200ms.
Individual and detailed results for this experiment can be found here: Experiment Batch Size vs Queue Depth
We measure the “true” number of cold starts. Counted from a log that is converted to metrics by EMF (Embedded Metric Format) and exported to CloudWatch.
The charts below show the cumulative number of cold starts over time for the first 1 minute, taken in 10 second intervals.
LEARNING:
- Your Lambda functions will not start or be invoked more aggressively the more messages you have in the queue.
- This experiment confirms what the AWS docs say. The ESM poller starts with 5 concurrent Lambda invocations.
#2. Lambda invocation and cold start rate are dependent on batch size
This comes as no surprise. Batch size does have an influence on the cold start rate. The difference is small but meaningful enough to make the conclusion.
More messages are processed per Lambda function, which reduces the rate at which new Lambda functions need to be started.
This experiment is the same as the previous one where we did batch size 1. Now we repeat the experiment for batch size 2 and 5 at the same varying queue depths (1,000; 10,000; 100,000; 1,000,000).
Individual and detailed results for this experiment can be found here: Experiment Batch Size vs Queue Depth
LEARNING:
- Increasing the batch size decreases the number of cold starts, but the invocation rate stays roughly the same.
#3. Lambda ramps up invocations aggressively, then drops sharply into steady state
The ESM tries to invoke as many functions as possible to process messages quickly. I call this the “ramp-up” phase. The invocation rate starts very high, then drops sharply into a steady state once it realizes fewer functions are needed.
We see this across different processing times. The faster the function, the more aggressive the ramp-up. This likely relates to howLambda concurrency scales with requests per second..
I have not been able to identify exactly what defines the ramp-up phase, but I do know what it is not:
- It is not the approximate number of messages in the queue
- It is not the age of the oldest message
In the 100ms test, both metrics stay at 0 on the SQS charts, yet the same ramp-up behavior appears.
My current theory is that the ESM poller uses some internal metric when invoking Lambda synchronously. It likely factors in processing time, invocation rate, and queue depth, but I have not identified this yet.
In the experiment we varied the processing time of the Lambda function (100ms, 200ms, 400ms, 600ms) and observed the total runtime. An SQS generator Lambda function is used to send messages to the queue at a constant rate.
Individual and detailed results for this experiment can be found here: Experiment Batch Size vs Processing Time
| Processing time | Total cold starts | Avg cold starts during ramp-up (per min) | Invocation ramp-up rate (per min) | Total invocations during ramp-up | Ramp-up time | Total run time |
|---|---|---|---|---|---|---|
| 100 ms | 195 | 157 | 10,843 | 50,871 | 1m 10s (28%) | 4m 10s |
| 200 ms | 358 | 265 | 9,237 | 55,734 | 1m 20s (31%) | 4m 20s |
| 400 ms | 795 | 281 | 5,265 | 128,758 | 2m 50s (65%) | 4m 20s |
| 600 ms | 1060 | 297 | 4,269 | 163,997 | 3m 30s (84%) | 4m 10s |
LEARNING:
- Functions with a shorter duration are more volatile in their invocation rate during ramp-up.
- The ESM poller does not seem to have a good backpressure signal when the function duration is short. It invokes the function as fast as possible, most likely limited by Lambda’s own limits.
- Right-sizing your ESM Concurrency is important for short duration functions to avoid invocation spikes. More on that in observation 6.
#4. Large Lambda deployments cause concurrency spikes if ESM Concurrency is unbound
This observation was found by accident while searching for the conditions that cause Lambda to be invoked more than the ESM concurrency.
For two different processing times, 50ms and 400ms, we observe the effect a deployment has every 3 minutes. An SQS generator function is called locally to send messages to the queue at a constant rate.
Individual and detailed results for this experiment can be found here: Experiment ESM vs Lambda Concurrency Uploads
I found that deploying a large package would create a spike in Lambda concurrency compared to its current steady state. Changing an environment variable on a large package had the same effect.
The charts below show Lambda concurrency spiking during a large upload. The Lambda processing time does not seem to have an influence on the spike.
The start of the 400ms graph is an error I believe, having started the experiment too closely to another.
We also see that throughput and invocations do not spike with this concurrency increase. This indicates it might only be a metric issue.
LEARNING:
- A deployment with a large package size will cause a concurrency spike but it will not cause a spike in the invocation rate. This means this strange behaviour should not cause any real issues.
- The concurrency spike is most likely just the deployment strategy of Lambda in action, probably a rolling deployment or blue/green.
#5. The ESM poller over-invokes above ESM max concurrency
The ESM Poller can invoke the function more than the set ESM max concurrency.
This is extremely difficult to prove. I don’t know what the exact conditions are but I know that this is possible as I have seen this in production multiple times. I was only able to replicate it twice during all my testing.
I have tested (with many different conditions):
- ❌ Enable ESM with large queue depth
- ❌ Steady queue consumption with bursts of higher messages
- ❌ Throw errors for 10% of all invocations
- ❌ Report Batch Item Failures and return the message to the queue for 10% of all invocations
- ⚠️ Deploy by doing a code change (more likely with a large package size, ~30 MB vs ~10 KB). Not consistent.
- ⚠️ Deploy by changing an environment variable (more likely with a large package size, ~30 MB vs ~10 KB). Not consistent.
- ❌ Changing Lambda max concurrency
- ❌ Changing ESM max concurrency
For the deployment test that could replicate this behaviour, we keep the processing time at 50ms and set ESM concurrency to 60 and Lambda concurrency to 70. We then do a deployment every 3 minutes and observe the Lambda concurrency and invocation rate. An SQS generator function is called locally to send messages to the queue at a constant rate. This is the same test used in the previous observation, but with the Lambda concurrency limit applied.
Individual and detailed results for this experiment can be found here: Experiment ESM vs Lambda Concurrency Uploads
Below we can see a spike only at the start of the deployment tests. It only happened once and I could not recreate it by repeating the experiment. Compared to the previous observation with a similar experiment, we see that a Lambda deployment will respect the ESM max concurrency and not exceed it (except for the start).
In this particular case though, we see a spike in Lambda concurrency that goes above the ESM max concurrency of 60, hits the Lambda concurrency limit of 70, and then throttles another ~55 functions. So more than double the set ESM max concurrency were started at once.
Good things to note about this behaviour:
- We see no messages being returned to the queue. My assumption is that the ESM Poller hit a Lambda throttle and held the message, retrying instead of returning it immediately.
- There is no increase in the age of the oldest message.
Bad things to note about this behaviour:
- With unbound ESM concurrency, we do not see an increase in cold starts but we do see an increase in invocations. This strengthens the theory that the ESM Poller invokes more functions than it needs. In this case it decided to invoke a greater percentage of them.
LEARNING:
- You can limit the impact of this by setting the Lambda max concurrency to the ESM max concurrency + 5.
- Hitting the Lambda concurrency limit and being throttled will not return the message to the queue or increase the processing time (measured by the age of the oldest message).
#6. The ESM poller creates more concurrent functions than it needs to invoke
Another accidental find while investigating the previous observation. This one is particularly concerning because it creates a false sense of security when setting the ESM concurrency, especially to protect downstream resources from bursts.
We keep the processing time at 50ms and vary ESM concurrency. We then reduce the ESM concurrency in steps below the recommended (observed unbound concurrency), which was recorded as 100. An SQS generator function is called locally to send messages to the queue at a constant rate. This was still the same test used in the previous observation that does deployments every few minutes, but this is not the main focus.
Individual and detailed results for this experiment can be found here: Experiment ESM vs Lambda Concurrency Uploads
I expected that halving the concurrency from 100 to 50 would have halved the throughput. It did not. It stayed the same. Only at 25 did we see the throughput drop, and even then it was only about 10%.
So for a function that takes 50ms to process, the ESM poller’s recommended (unbound) concurrency was 100, yet it behaved the same at 50% of that value. We only saw a gradual queue backlog and throughput decrease at 25% (25 instead of 100) of the recommended concurrency.
We could probably reduce to about 65% of the recommended concurrency without any decrease in throughput or increase in queue backlog.
Given that 400ms processing time showed different behaviour in previous tests, I wanted to see if the same would apply here. Sure enough, it did.
The issue still exists at longer processing times, but it is more extreme with short processing times (50ms vs 400ms).
LEARNING:
- The ESM poller invokes more functions than it needs to keep a pool of warm functions ready for spikes.
- This creates a false sense of security when setting the ESM concurrency. A spike can still happen and hurt downstream resources.
- The Lambda concurrency the ESM poller settles on with no limit can be reduced without creating a queue backlog.
The ESM Max Concurrency can be set to:
- at 50ms: ~60% to ~70% of the unbounded value
- at 400ms: ~20% of the unbounded value
- Experimentation is the only way to find the real ESM concurrency limit your workload can handle.
#7. Errors have a significant impact on throughput
Another surprise is the devastating impact errors can have on concurrency and throughput. A 1% error rate reduces throughput by 20%. At a 10% error rate, throughput is reduced by 85%.
Here we set processing time at 50ms and ESM concurrency unbound. Then on every 5th to 9th minute, we throw an error depending on the percentage for that experiment. The error is thrown at the start of the function. This test duration is longer, at 22 minutes, to better see the impact.
Individual and detailed results for this experiment can be found here: Experiment ESM vs Errors
The Invocation chart is clamped at 3,000 invokes per 10 seconds because these tests were done with unbound ESM concurrency and it spikes to much higher values (to see the result without the clamps visit the detailed results)
We see peaks of 30,000 (10x) after the errors stop and the function recovers. This is likely because throughput is reduced, causing a backlog in the queue, which then causes a spike in invocations when the function recovers and starts processing the backlog.
It is also interesting that the number of errors reported by Lambda is roughly the same at 5% and 10% induced error rates. This is because throughput is reduced and the ESM is invoking Lambda less frequently.
LEARNING:
- Never throw an error when processing an SQS message. Always return it with Batch Item Failure instead.
- Do not create alerts on the absolute number of Lambda errors. Use the success rate of the Lambda instead.
#Worth mentioning
-
The ESM Poller can cause duplicate processing on top of the SQS at-least-once delivery guarantee. I did not know this so thought it was worth mentioning when I read it in the docs here.
Lambda event source mappings process each event at least once, and duplicate processing of records can occur. To avoid potential issues related to duplicate events, we strongly recommend that you make your function code idempotent.
That means both SQS and the ESM can cause duplicate message processing.
-
Not all functions that are started are used. This is an AWS Lambda behaviour, not an ESM one. Proactive initialization is at play when you do not set the Lambda concurrency. Fellow AWS Hero AJ Stuyvenberg has a good write-up here: https://aaronstuyvenberg.com/posts/understanding-proactive-initialization
-
Returning messages to the queue with Batch Item Failures does not seem to have an impact on the concurrency or invocation pattern, unlike what we saw with errors.
#Testing
The code and experiments is rough, unstructured and not documented. I’m publishing it so that you can also run these but be warned you will not have the exact same results as I did. Reach out if you are interested to run these and need help.
All tests and results are available in this repository: sqs-lambda-esm-scaling-behaviour
#Learnings Summary:
- [1] Lambda invocation and cold start rate are not dependent on queue depth
- Your Lambda functions will not start or be invoked more aggressively the more messages you have in the queue.
- [2] Lambda invocation and cold start rate are dependent on batch size
- Increasing the batch size decreases the number of cold starts, but the invocation rate stays roughly the same.
- [3] Lambda ramps up invocations aggressively, then drops sharply into steady state
- Functions with a shorter duration are more volatile in their invocation rate during ramp-up.
- The ESM poller does not seem to have a good backpressure signal when the function duration is short. It invokes the function as fast as possible, most likely limited by Lambda’s own limits.
- Right-sizing your ESM Concurrency is important for short duration functions to avoid invocation spikes.
- [4] Large Lambda deployments cause concurrency spikes if ESM Concurrency is unbound
- A deployment with a large package size will cause a concurrency spike, but it will not cause a spike in the invocation rate. This means this strange behaviour should not cause any real issues.
- [5] The ESM poller over-invokes above ESM max concurrency
- You can limit the impact of this by setting the Lambda max concurrency to the ESM max concurrency + 5.
- Hitting the Lambda concurrency limit and being throttled will not return the message to the queue or increase the processing time (measured by the age of the oldest message).
- [6] The ESM poller creates more concurrent functions than it needs to invoke
- The ESM poller invokes more functions than it needs to keep a pool of warm functions ready for spikes.
- This creates a false sense of security when setting the ESM concurrency. A spike can still happen and hurt downstream resources.
- The Lambda concurrency the ESM poller settles on with no limit can be reduced without creating a queue backlog.
The ESM Max Concurrency can be set to:
- at 50ms: ~60% to ~70% of the unbounded value
- at 400ms: ~20% of the unbounded value
- Experimentation is the only way to find the real ESM concurrency limit your workload can handle.
- [7] Errors have a significant impact on throughput
- Never throw an error when processing an SQS message. Always return it with Batch Item Failure instead.
- Do not create alerts on the absolute number of Lambda errors. Use the success rate of the Lambda instead.